This is part of a series of blogs intended to help marketers improve Quality Score and drive down CPCs. For more information on Quality Score and how to improve it, see this resource.
The 3 Components of Adwords Quality Score
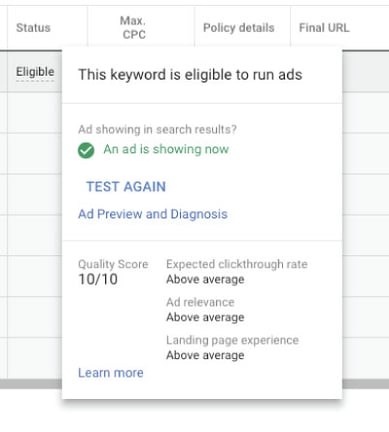
Quality score is determined by 3 main components: expected clickthrough rate, ad relevance, and landing page experience. These three components receive a status of above average, average, or below average to determine the ad’s overall quality score. You can find these statuses by clicking into your keyword and hovering over its status, as shown below.

Expected clickthrough rate
Expected clickthrough rate (CTR) is determined by historical CTRs of ads with your chosen keyword. It is reflective of how closely the keywords you’ve selected align with the search terms used in real-time.
Google says, “This status predicts whether your [chosen] keyword is likely to lead to a click on your ads.” and that, “Google Ads takes into account how well your keyword has performed in the past, based on your ad's position.”
Ad relevance
Ad relevance refers to how closely your ad’s copy relates to the keywords you bid on. So if you bid on “dogs” but make no specific mention of it in the ad, you will likely receive a status of “below average” here.
Landing page experience
Landing page experience measures how relevant and useful your landing page is to someone who clicks on your ad. If visitors often bounce, not finding what they were looking for, or the page takes too long to load, your landing page experience will suffer. And in turn, your quality score will pay the price.
Quality Score Components Weights

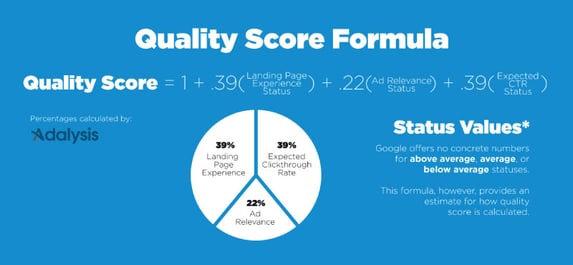
According to AdAlysis’s reverse engineering of the Quality Score components' weights (Landing Page Experience, Ad Relevance, and Expected CTR), the three were found to hold weights of 39%, 22%, and 39%, respectively.
This suggests that improving landing page experience and expected clickthrough rate may offer the greatest reward, per your energy, for improving your overall quality score.