See DemandJump in Action
By embracing DemandJump's approach to SEO, we have been able to increase our organic rankings within just 2 weeks of implementing recommendations. This helped us see a 22% increase in organic search month-over-month.
Robert Jacko Vice President Digital Marketing @ Homage
DemandJump has become a crucial extension of our marketing team, providing game changing insights to fuel and propel all aspects of our digital marketing efforts. The DemandJump platform is a must have, we are seriously impressed.
Tim Lavinder Director of Ecommerce @ Hotsox
We used to spend hours looking for insights in dozens of tools and reports. Now we log into one place to find out what customers are doing and how to meet them where it matters most.
Zach Roop Digital Marketing Manager @ Dometic
We use DemandJump recommendations as our digital to-do list. We love going in and seeing the recommendations and knowing what to do next.
JoLynda Wilson Marketing Director @ IWC
Trusted by Brands Around the World
DemandJump Product Suite
Eliminate wasted time and spend. With DemandJump's content, insights, and attribution
you will know with certainty how to win by aligning your marketing to actual consumer behavior.
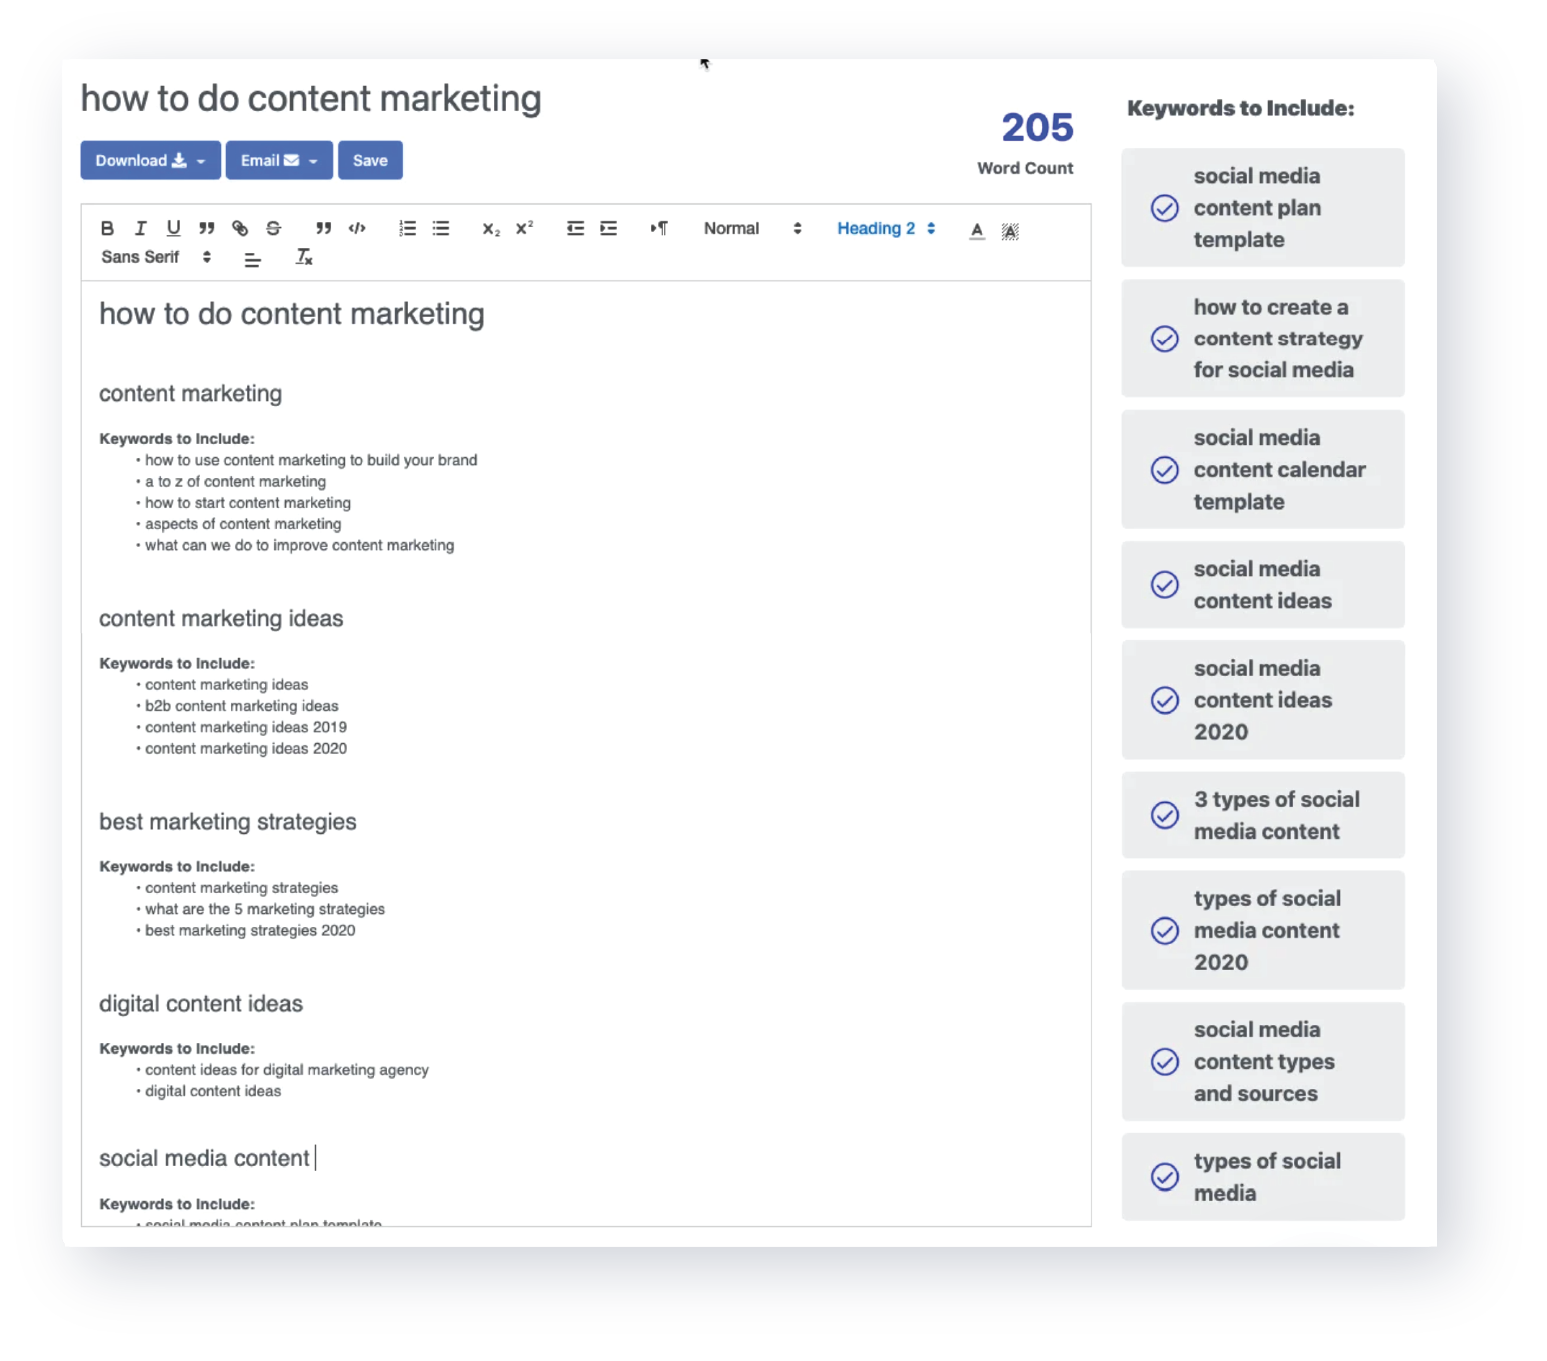
Content
DemandJump assembles the world’s data, creates networks of customer touchpoints around any topic or keyword, and tells you exactly what content to write, keywords to include, videos to produce, and much more.
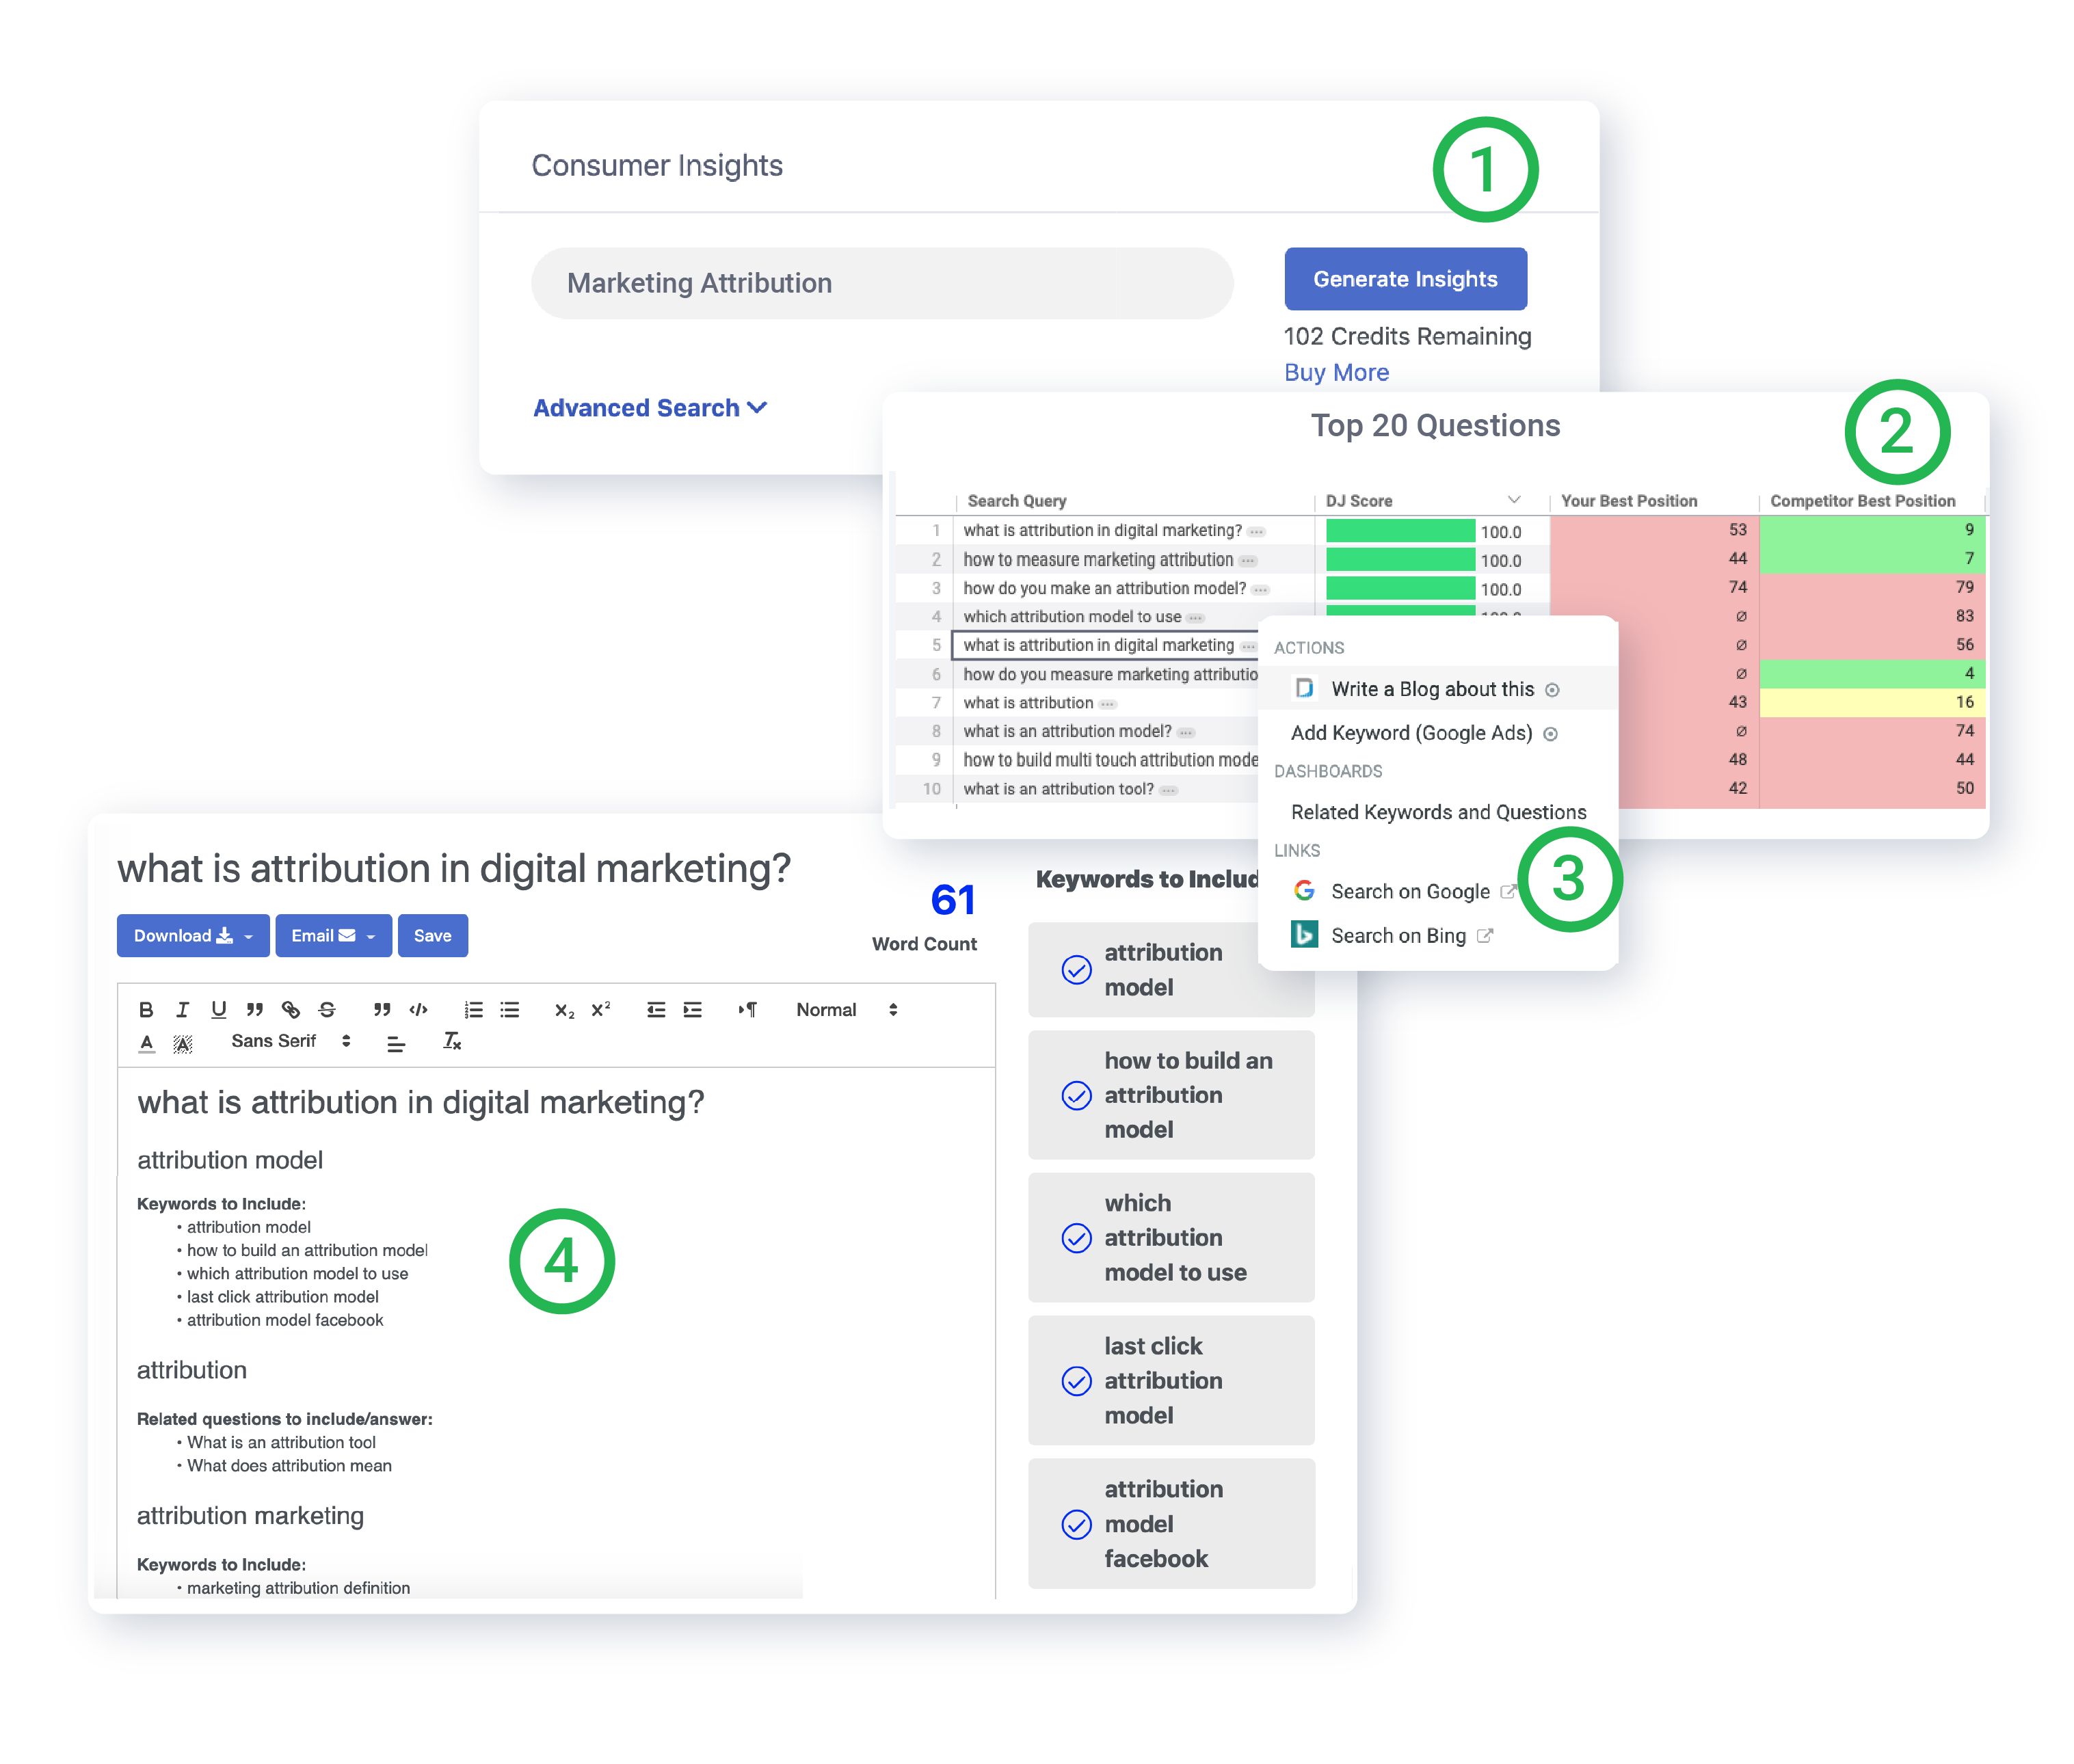
Insights
Find out what your target audience cares about for any category, product, or topic, with the click of a button. Gain market share by aligning your marketing efforts to actual customer behavior.
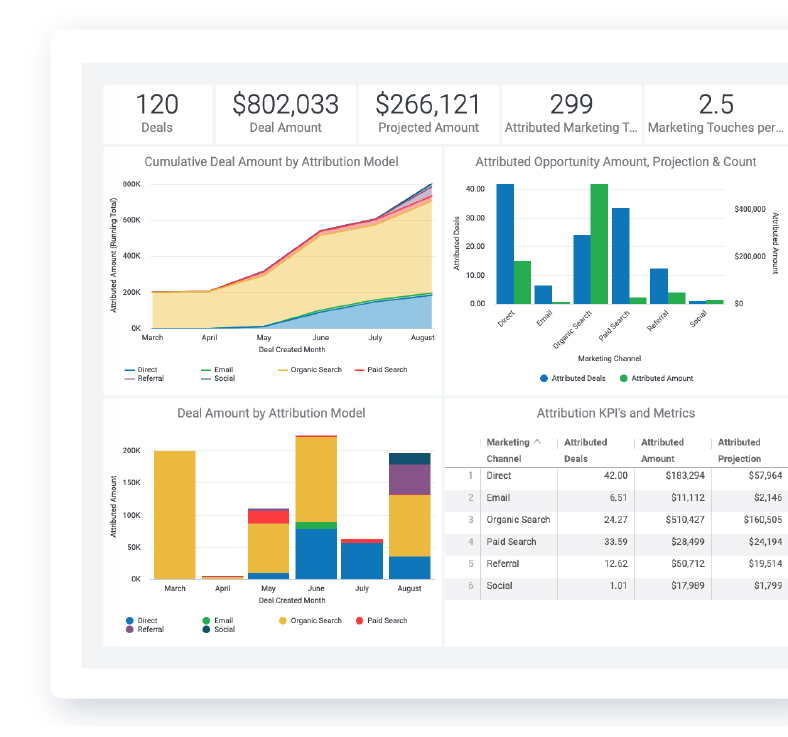
Attribution
Eliminate wasted time and spend. With DemandJump's automated account-based attribution solution you will know with certainty which efforts are driving ROI.
See a Demo of DemandJump
Key performance indicators, or KPIs, are used in every organization and at all levels. If you run a small business and haven't been using the term KPI, you're still using these indicators. You might be calling them benchmarks or simply noting them as analytics. A key performance indicator is basically a factual piece of information, statistic, or data point that tells you whether you're reaching a goal.

These indicators can be used to judge the overall performance of the organization or individual departments. When you set your marketing strategy, for instance, you'll determine benchmarks that you want to reach. You may have a goal of increasing traffic or conversion or might have a goal of increasing your mailing list. Any portion of your process can use this strategy.
The key performance indicators that you're looking for will be measurable. Not every data set is quantified by default, which means that some of your KPIs will not always start as a true numeric value. But there should still be a way to determine growth or whether you're reaching a target goal. KPIs should be measured on a regular basis. This will help you determine how well your strategy is working, whether you're on target to meet set benchmarks, and to help inform your process if you need to change some aspect of your current structure.
For instance, in your marketing strategy, analytics help inform how you run campaigns so that you can be more flexible and adapt to what’s working. This allows you to change course rather than continue throwing effort and marketing funds toward a campaign that won't reach the strategic goals.
Organizations use key performance indicators in a variety of ways and across each department. There are high level KPIs that often deal with the overall performance of the whole organization. The lower level KPIs often deal with individual processes or indicators that are only used within one set department or marketing campaign. All of your key performance indicators should be viewable in one central location in order to see patterns that can help streamline workflows and better inform business protocols.
Because KPIs can virtually be any measurement that shows growth (or decrease) in your business performance, there can be some confusion as to the best key performance indicators to pay attention to and study. In this article, we'll give a refresher on what key performance indicators are, how to measure them, how to determine the important KPIs for your business, and some examples.
What Are Key Performance Indicators (KPIs)?
The term Key performance indicator refers to quantifiable benchmarks or metrics that help businesses track progress toward goals. When you determine the KPIs that you need to keep track of, it’s best to define a few things about it so that you can make sure that the measurement will weigh out in terms of accuracy and quality. The way that a KPI is measured should be easy and accurate — often the best KPIs are ones that are numeric or easily show the performance. For instance, one of your KPIs for an online class offering might be the number of registrants. This is easily measured and correlates directly to profit or business outcomes.
The profit margin is only part of your company's story, though. One area where most businesses pay a lot of attention to key performance indicators is in the HR department. Employee KPIs are integral to a company's success in a number of ways. For instance, high turnover rates cost companies an extensive amount of time and investment in training new employees. It's also a good indication that there may be an issue with management or culture. All of these influences together have a direct impact on the success of the business.
Some KPIs to look for in this area might include employee engagement and satisfaction. The higher employee satisfaction is, the lower your turnover rate will be. High turnover can be due to pay scale, management, culture, or an employee’s perceived room for growth at the organization. To keep a closer look at the KPI in this area, many companies use yearly reviews and give employees the opportunity to offer company feedback that can help assess performances and make changes where necessary.
SMART KPI is a way to determine your key performance indicators that's been around for about 40 years. The word, SMART stands for Specific, Measurable, Attainable, Realistic, and Timely. Using an acronym makes these benchmarks easier to remember, but it still takes some intense thought and research to make sure you're including the right indicators for the best assessments. Let's break SMART down to highlight the qualities an indicator needs to have in order to serve as a KPI with this system:
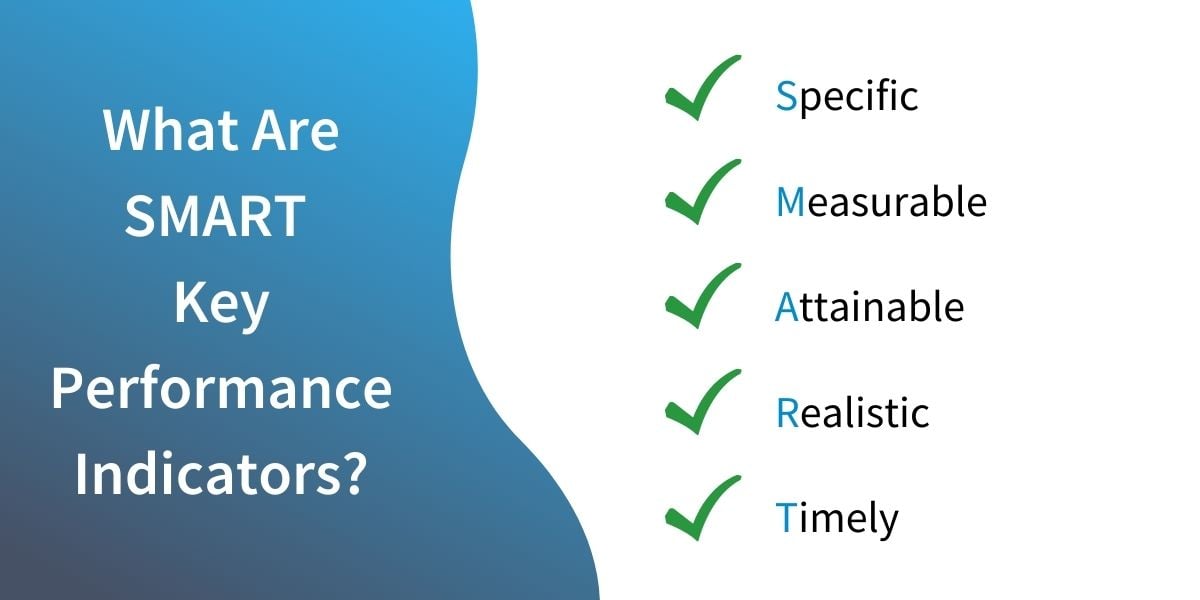
- Specific. The KPI you're looking at needs to be specific enough that the information gathered will be relevant and provide information that you can act on. The broader the indicator, the harder it is to verify why you're succeeding or failing in that area.
- Measurable. The best KPIs are numeric or can be measured in a quantifiable way. You can determine a percentage or place a value that easily shows performance that you can benchmark against past and anticipated numbers.
- Attainable. KPIs are not the place for pie in the sky goals. You want to make sure that you set your KPIs so that they are achievable but not so simple that you're not moving the needle at all.
- Realistic. Your KPIs should be a measurement that's realistic for where your company is and what you hope to achieve in the short term. You can move the goals as you achieve them but this isn't the place for your long term vision.
- Timely. You need to determine the schedule on meeting KPI. For instance, employee KPI might be set at a yearly schedule. Other indicators may need to be reviewed weekly or monthly.
Quality KPIs often have to do with the quality of service or products. These performance indicators also have direct bearing on aspects of overhead, profit, and cost. For instance, the cost of poor quality can include work incidents that result in breakage, loss, and tasks that need to be redone. Quality KPI can deal with customer retention or satisfaction and customer service. It can also involve employee training and other aspects of delivering quality services.
How Do You Calculate KPI?
Calculating KPI can be a bit trickier than gathering the information. As we've noted, there are wildly different types of key performance indicators. The way that you measure or calculate your performance depends on the type of data you've gathered. Your best information might be a hard number or it might be a percentage. In some instances, percentages will tell you more about your productivity than the straight numerical value.
Because there are different ways to determine the numerical value, you may also choose tools to help with accuracy. A KPI calculator is available in Excel, which is quite handy if you're working in these documents. There are also numerous apps and tools you can use to determine KPI.
There are a few basic types of calculations which are used in key performance indicators. These include:
- Data Counts. This is a simple count which mounts over time. For instance, you might keep a count of safety incidents in a warehouse. Obviously, the longer you go without an accident the better your performance. Other counts are not as informative. The number of sales calls made is often logged but not exceptionally relevant without comparing it to the percentage of sales closed.
- Sums and Totals. These KPIs might measure hours in the workforce. A 10 person staff working a 40-hour week is 400 man-hours. These numbers also change depending on the staff and the hours.
- Percentages. Percentages can be a good way to measure KPI. For instance, you can see that a campaign brought 10,000 visitors to your landing page. But the relevant number may be the percentage of those visitors who converted to sales. On the other hand, you may convert more of those initial visitors to a sale after a follow-up email and a second or third visit. These analytics are likely to be seen more clearly in percentages than in data counts, for example.
There are a number of ways to calculate your KPI, depending on what you're measuring. You might need to determine your ROI, or return on investment. This is a particularly useful measurement to determine in marketing because it allows companies to see whether their campaigns are reaping a direct result. However, this can also be a tricky KPI to master because some marketing activities, such as content marketing, can be a long term effort that builds cumulative results.
KPIs are measured in various departments. This might include your profit margins, training costs or costs per hire, and other overhead costs.
The Importance of KPIs
Key performance indicators help the company determine the success rate of their performance. They are used in all departments and for the overall management of the company. Some examples of things that KPIs measure include employee performance, training time, sales, marketing, and man hours. The benefits of KPI are that they allow for more accurate assessment of company progress in meeting goals. They also showcase areas where improvement is needed.
KPIs in marketing can seem difficult to assess, but with the right analytics marketing success becomes much easier to track and evaluate. Within these tools and platforms, it’s important to understand what indicators are important to help gauge the success or failure of efforts. Companies want to invest money in ventures that reap rewards. This is a necessary goal because no company can survive if it continually loses money.
A KPI report is a visual representation of your data, and they are created in order to showcase the relevant information in an easily understandable way. This might be included in a platform dashboard or through regularly downloaded reports that are used for assessments. Reports are created uniquely for the department or organization and use the specific data sets that have been predetermined to showcase current performance in these areas.
You can use a reporting tool or dashboard to generate the KPI report. It’s important that the software or solution you choose integrates with your current database and analytics. You can also set your KPI tool to alert you to sudden changes that need to be monitored. For instance, you might set the dashboard to alert you if your website traffic suddenly drops below a certain threshold. When setting your KPIs it’s important to think through the process to determine what actions should be taken if the metric hits a negative or positive benchmark.
The reports you generate should be visually stimulating and easily accessible for all team members. To do this, you need to make sure that all of the data points are accessible and that each member of the team to view the report will have access to and an understanding of the information being generated. In other words, the reporting needs to be communicated in a way that it helps the staff to assess the information and gather insights or actions.
Your workflow and the data sets can be changed to reflect new KPI interests as they become apparent and your performance indicators should be reviewed on a regular basis to make sure that you’re including all pertinent data sets.
Good KPIs are measurable and offer concrete proof that the organization or department is meeting (or falling short of) their goal. You should be able to look at your KPI and determine whether performance has improved or stayed the same from past reporting. In cases where you’ve initiated new KPI, you will not be able to compare with past performance in that area but should be able to determine if the goals set for that initiative were realistic and whether you had met them. If the KPI shows that performance is exceptionally short, it may be an indication that the goal was not realistic to meet and may need to be reassessed.
How to Measure KPIs
There are different metrics and measurements used to determine performance. KPI metrics can include a number of wide topics and the type of metric you’re looking for depends on the area of the business you need to improve. The measurements will be determined by what type of KPI you’re investing the time and energy in studying.
Each company may have their own specific KPI to focus on at any given moment and the internal departments might have their own prioritized list. So measuring your KPI metrics can be unique to the company, area, market, and the specific performance set that’s proving to be a pain point.
In most cases, KPI that is concentrated on are the ones that will reap the most benefit or where the shareholders have decided that the company needs to improve. Marketing is often an area where KPI measurements are exceptionally important. A great marketing firm can showcase the ROI with their services. This means demonstrable KPI for initiatives.
The KPI metrics that marketing should be concerned about are often in regard to ROI. The company and financial decision makers need to know that the spend in marketing is generating more revenue than it costs. This is an obvious need but sometimes it can be a difficult to pinpoint metric. Some marketing initiatives don’t reap immediate or easily quantifiable results.
Building meaningful KPIs for marketing is dependent on a good understanding of consumer behavior and consumer insights. As many digital marketers can tell you, a large number of consumers need to have contact with the brand more than once before converting to a customer. While this is easily explainable in words, you still need to show metrics which prove the marketing initiative’s worth. There are KPI which you can and should highlight. In some cases, campaigns can be measured over a longer period of time, and they will show a marked increase over that time, which is more telling than short range analytics.
Some of the KPIs that you should be including with your marketing department include sales revenue which can be traced to individual campaigns. You can also use metrics which show increased traffic that doesn't result in conversion, increased mailing lists, increased social engagement and increased open rates on email campaigns. Of course, you will not always show an increase. If you’re seeing marked decrease in any of your analytics, it’s time to reassess the process and possibly change the campaign message or even the channel you’re utilizing most often.
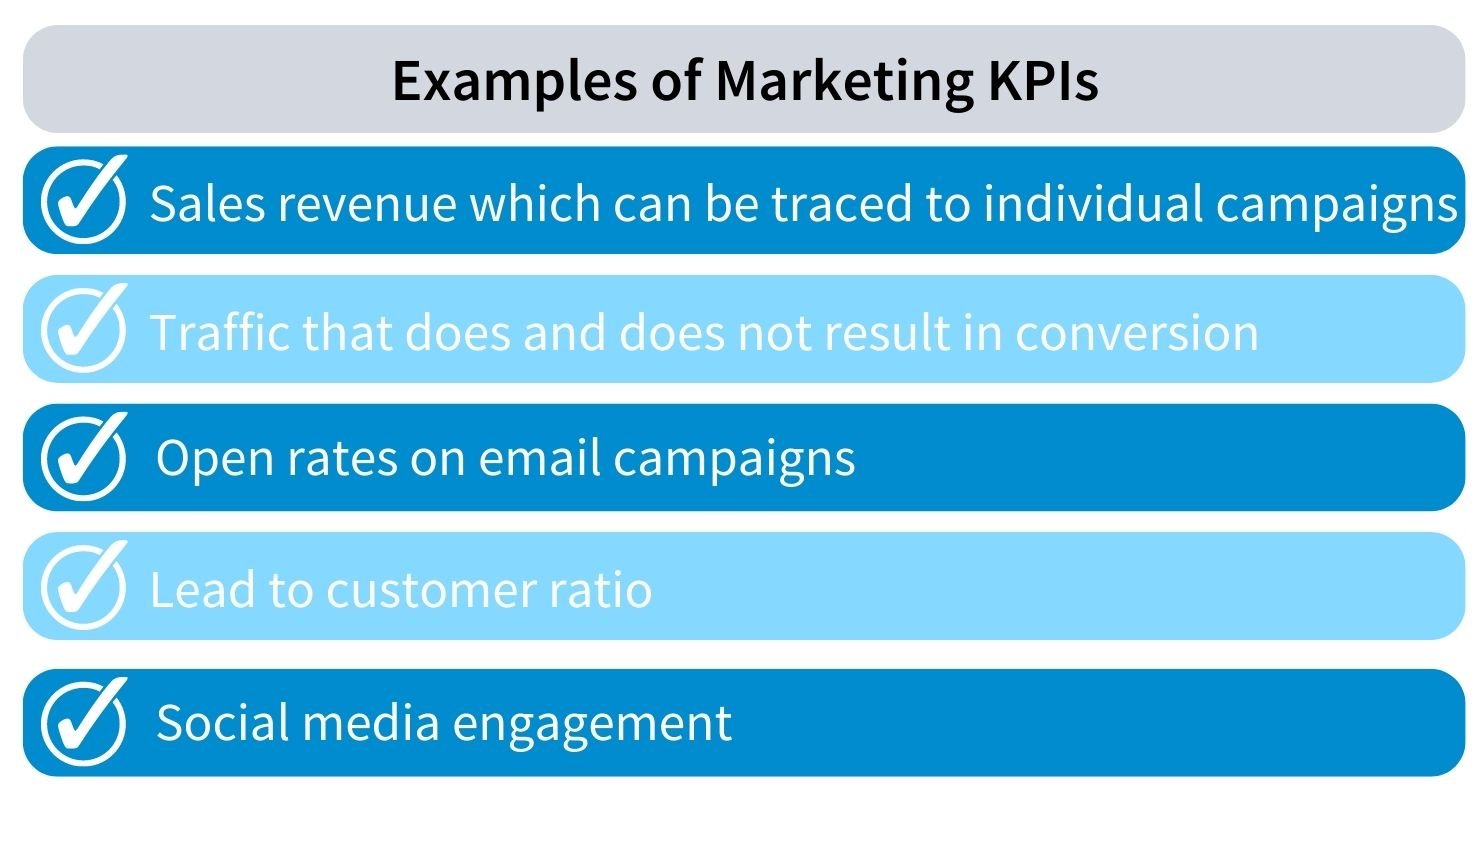
You can also determine your lead to customer ratio. This KPI will be determined using both the marketing and sales analytics. Cross-channel marketing analytics can help determine which contacts were passed through the funnel as a lead to sales. The sales metrics can showcase the percentage of those leads which are converted to customers. This is an important metric because it can help improve both the marketing process and the sales so that these departments work together in a more efficient way to better serve the end customer.
Your digital analytics are becoming more and more important in your content marketing strategy as an increased number of prospective customers are finding your brand online. The percentage of customers who check a company website before deciding to do business with them is high and 85% of users think that the website should be accessible on mobile. So your mobile analytics should be included in your KPI measurement. This might include conversion for mobile users, number of return visits, and length of time on the site.
If you’re running specific campaigns, you may want to adjust KPIs to look at conversion from landing pages, conversion from social media posts, and conversion from email campaigns. Your metrics will be dependent on the activity.
You track and measure your metrics using your analytics and reporting tools. The formulas that you can use will depend on the type of KPI you're measuring.
KPI Tools
Developing your KPI can be a difficult process. This is largely because you start with a blank slate. You need to determine what your KPI objective is before you begin. Now, this process can be decidedly easier if you already have an objective in mind. If you’re looking at a series of KPIs that did not meet the objectives you were looking for, you already know where to start. If you’re looking at a specific report that indicates an area where the business needs to improve, it’s already given you the information that you need to begin.
While you may know what you want to improve, setting the objective should be fairly precise. You don’t want to set an objective that’s impossible to meet but you also don’t want to make it too simple. Ideally, it should be a goal that the company needs to strive to meet but which is obtainable in normal conditions.
Your benchmark showcases a successful KPI, though you might work on a spectrum. Though exceeding the benchmark by a great deal might indicate that the target was too low. As you develop your SMART KPI, you should decide on the type of metric you’ll be looking to develop.
The most effective way to drive your strategy is to set multiple KPIs and each of these needs KPI targets. Targets are your objectives. You need to set the benchmarks to have a good view of whether you’re meeting performance goals. It takes a great deal of time and effort to develop KPIs, but that’s only a portion of the workload.
Your KPIs are often long-term measurements. It’s important that you assess them on a regular schedule. Look at each of your KPIs and prioritize them in terms of the strategy where they are important. For instance, all of your marketing KPIs should be included in your overall marketing plan which then nests within the whole organization’s performance. If you’re looking at your marketing KPIs, you should have a hierarchy of importance. And still, each of these KPIs should be assessed on a regular basis to move markers when needed and to assess whether you’re reaching your goals.
You should have overarching goals of five or ten years. You should also have short term goals that may occur bi-monthly, monthly, or annually.
So how do you keep track of all of your KPI targets across all departments? With KPI tools. This is quite possibly the best thing about the digital age, all of the tools you need to assess your metrics across all of your departments are available.
KPI software can be used to integrate with all of the solutions you currently use in your organization. This is a fantastic option because it can connect all of the departments and gives a full and robust reporting that doesn’t drop any of the data. Because data can be pulled through to the database, you won’t have to worry about data entry errors unless they’re already in your original data sets.
This software is specifically designed to help develop the reporting options you need. So your software includes a KPI dashboard that should be easy to use and navigate. Some options you’ll readily see include real time information. Some software allows you to customize your dashboard more than others and some solutions can be used directly without much customization. It’s ideal if you work with a company or vendor that offers support to help train staff and make sure that all of your programs integrate correctly.
KPI software can be used to provide insights on the whole organization’s performance, as well as individual employees, teams and departments. This can be a great aspect to the solution because it becomes much easier for managers to see where more training may be needed. You can determine which departments are more productive and find internal and external trends.
The data and reporting can be shared internally and it can be printed and disseminated externally, as well.
Choosing the Right KPI Software
The KPI software your company uses will depend on the individual users and preferences. There are a number of good solutions on the market. Not all of your employees will need to use the software. It can be reserved for those working with management and decision making initiatives in set departments.
There are a number of issues you should consider when researching a KPI software solution. The price is always a consideration. Though, make sure you weigh the quality of the product and possible ROI. Ease of use should be a consideration, as well. The dashboard should be easy to use and, unless your company is in the technology industry, you likely don’t want a solution that’s too difficult to program and install.
The best KPI tracking software integrates with a variety of other data sources and enables you to dig into other data sources when a question you have regards them.
It’s a good idea to get employee feedback on the solution before making a decision. The dashboard should be easy to navigate and offer robust reporting options, as well.
KPI Examples
Quality KPI examples can include assessments that give you performance indications of staff, management, or the organization as a whole. Some KPIs you’ll want to look at routinely to determine quality include KPIs that deal with customer retention and engagement. For instance, if you set a goal of increasing social mentions of consumers by 3x, your KPI would be the number of social mentions, which you could track in your social media analytics tools. Social mentions by customers are one of the most effective marketing offerings, and they don’t cost anything.
Key performance indicators for employees should include metrics that give you an indication of how well management is doing and whether the company culture is positive. A successful company strives for employee retention for a number of reasons. First, it costs a great deal to train employees, so it’s advantageous to keep them for a prolonged period and ideal to promote from within.
There are several ways to assess employee performance throughout the year. Reviews which are conducted should include current skill level/work level as well as categories for improvement and categories where they may excel. Every employee and position is different so it helps to reassess their skill level on a regular basis to see if they may benefit from more responsibilities or have too high of a workload.
One you might look for in KPI for employees include employee performance information. This information may be subjective and supplied by management through yearly review. You might include a numeric rating system on this type of review so that a low score or low scores on subsequent reviews might trigger another review. Conversely, high scores might result in pay raises or promotion opportunities. KPI derived strictly from one manager should not be the only metric involved in employee assessment. For obvious reasons, that might result in favoritism or bias, depending on the case. It’s always best to use multiple assessments for these metrics.
Some other employee metrics might include productivity in the department, specific employee productivity, errors, sick days, and other variables that are deemed important for productivity in your workplace.
Key performance indicators for managers should also be assessed and are often reviewed more closely than the employee KPI. Managers have more responsibility in moving productivity and creating the company culture. Errors and productivity issues often fall on managers to explain and remedy.
Some KPI you’ll need to review where management is concerned includes employee turnover and retention rates. Management is not the only determining factor in a high employee turnover rate, but it can be one factor. Employees list a number of reasons for being unhappy with their current position. Salary, management, career growth potential, and company customers are often the first things mentioned. So if you have a high employee turnover rate in the same department, the manager should be assessed closely. They may need retraining or may just have communication issues with those particular staff members.
Management should also be given credit when their department performs well above average in productivity. A great manager can be the best asset a company has.
You may also want to set reviews so that employees and managers can assess themselves and their departments. This information is often qualitative, rather than quantitative but it can tell you a great deal about the company culture in each department and where improvements can be made.
Key performance indicators can be used throughout the organization to promote growth and encourage healthy company culture.
Resources
Channel Optimization
Consumer Behavior
Consumer Insights
Consumer Insights and Analytics
Competitor Analysis Tools
Content Marketing
Content Strategy
Cross-Channel Analytics
Customer Insight Research Techniques
Customer Journey Map
Market Intelligence
Marketing Analytics Techniques
Market Research
Marketing Attribution
Opportunities of Internet Marketing
Types of Consumer Insights


